Scott Dixon
Metaphorics, LLC
![]()
Scott
Dixon
Metaphorics, LLC
Our goal is to provide tools to explore the relationships between chemical and biological information.
One place to see the interface between chemistry and biology is in ligand-protein binding. The structural information contained in the Protein Data Bank shows how small molecules interact with proteins. So we want to view the data with emphasis on the interactions rather than on the protein structures.
Binding interactions between small molecules and proteins
Sequence similarity: Smith Waterman PAM250 sequence similarity.
Daylight fingerprint Tanimoto similarity
"What's related" (to be covered later).
Start with the information contained in the PDB.
convert is a program for parsing the PDB files, finding ligands and generating connectivity based on geometry. It has been extended to capture more information from the PDB file including remarks, sequences, journal references, etc. It puts out a large TDT file containing the information used for further processing.
For the current version of the PDB, we generate a 3.0 GB TDT file containing ~16,000 entries.
We would like to have a representation which makes it easy to see the interactions between the ligand and receptor. Our inspiration came from the LIGPLOT program (Wallace, A C, Laskowski, R A & Thornton, J M, "LIGPLOT: A program to generate schematic diagrams of protein-ligand interactions.", Prot. Eng., 8, 127-134 (1995)) from which we took some ideas about 2D schematic representation of protein-ligand interactions (although none of the code or algorithms).
An example of the representation we generate:

We
call this representation PLAID (Protein Ligand Accessibility and
Interaction Diagrams).
First, we need to find the interactions between protein and ligand. This is done by searching for matches to rules expressed in the SEA (Selection, Expression, Action) language which allows for specification of the chemical and geometric requirements for non-bonded interactions (H bonds, van der Waals). The selection part of each rule allows searching for a combination of SMARTS patterns and chain names, residue names and/or numbers and atom names. The expression parts allow for testing of geometric features (distance, angles, torsions, solvent accessible area, sum of vdW radii, distance from site point) for the atoms matched in the selection parts. The action parts allow atoms to be marked as in interactions for further processing or for geometric features to be printed out.
The SEA rule matching code is also being used in a collaborative project with Chiron for recognizing desired features in docked structures (Magnet).
Given a list of the interactions, the next step is to compute a 2D representation of the ligand and the interacting parts of the protein. We do this with a 2D version of the rubicon distance geometry (DG) method. The steps are:
Use SMARTS rules to assign distance constraints for the 2D representation of the ligand and receptor atoms. These rules are actually more complicated than the rubicon rules for 3D conformation generation since there are more special cases to get reasonable 2D depictions
Use the list of interacting atom pairs to assign further distance constraints so that interacting atom pairs are depicted near each other.
Generate 2D coordinates using DG by embedding into 3D initially and then squeezing out the third dimension during optimization.
The program which does the SEA rule matching and 2D DG steps is interplay (INTERaction Pattern Layout). interplay takes as input a set of SEA rules and the PDB TDT and outputs an annotated TDT containing PLAID subtrees with 2D layouts for each ligand in each PDB entry tree. For example:
$SMI<smiles for protein>
NAM<7dfr>
header<OXIDO-REDUCTASE                         21-OCT-88   7DFR>
source<"(ESCHERICHIA $COLI) /TMP$-RESISTANT STRAIN /SK383$~ CONTAINING /DHFR$ OVERPRODUCING PLASMID $P/UC8$">
compound<"DIHYDROFOLATE REDUCTASE (E.C.1.5.1.3) (/DHFR$) COMPLEX WITH~ FOLATE AND /NADP$==+==">
author<C.BYSTROFF,S.J.OATLEY,J.KRAUT>
journal<...>
remark<...>
formula<2;  FOL    C19 H17 N7 O6 -->
formula<3;  NAP    C21 H26 N7 O17 P3 +>
formula<4;  HOH   *55(H2 O1)>
revdat<3;   15-JUL-92 7DFRB   2       CONECT>
revdat<2;   15-OCT-90 7DFRA   1       JRNL>
revdat<1;   15-JUL-90 7DFR    0>
footnote<...>
sequence<" ";MISLIAALAVDRVIGMENA....>
ATNAME<...>
ATNO<...>
RESNAME<...>
RESNO<...>
ACCESS<...>
$PLAID<7dfr-FOL-1>
SMI<*.*.O.O.[NH]C(CCCNC(=N)N)[C]=O.[NH]C(CC(=O)O)[C]=O.Nc1nc2ncc(CNc3ccc(cc3)C(=O)NC(CCC(=O)O)C(=O)O)nc2c(=O)[nH]1>
NAM<FOL-1>
AID<120,196,1314,1350,224,225,...>
ATNAME<" N  , N  , O  , O  , N  , CA , CB , CG , CD , ...">
ATNO<229,391,1355,1391,440,441,444,445,...>
RESNAME<"PHE,ILE,HOH,HOH,ARG,ARG,ARG,...">
RESNO<31,50,206,301,57,57,57,57,57,57,57,57,57,57,...>
CHAIN<" , , , , , , , , , , , , , , , , , , , , , , , , , , , , , , , , , , , , , , , , , , , , , , , , , , , , , , ">
ACCESS<0.00,0.00,0.00,0.00,0.27,1.03,0.00,0.00,0.00,0.00,0.00,0.00,0.00,...>
ROLE<N,N,W,W,R,R,R,R,R,R,R,R,R,R,R,R,R,R,R,R,R,R,R,L,L,L,L,...>
D2D<0.18;;-1.41,-3.61,-0.64,4.90,-5.10,4.80,-5.09,-4.92,13.73,-0.38,12.96,0.25,1...>
NBND<1229,1142,H,3.181272>
NBND<1254,1029,H,3.028581>
NBND<1255,1030,H,3.131742>
NBND<1260,1143,H,2.643371>
NBND<1229,1350,H,2.773172>
NBND<1259,1314,H,2.848458>
NBND<1239,196,N,3.681517>
NBND<1242,120,N,3.617994>
NBND<1242,120,N,3.323706>
NBND<1242,120,N,3.829952>
NBND<1243,196,N,3.990238>
NBND<1243,196,N,4.052792>
NBND<1243,120,N,3.709318>
NBND<1243,120,N,3.924594>
$PLAID<7dfr-NAP-2>
...
$D3D<...>
|
Applying interpay to the current PDB TDT gives a 3.5 GB TDT output file with 8915 PDB entry trees containing 5875 unique protein chain sequences (19,178 sequences in total). There are 23,760 PLAID subtrees for ~15,000 unique small molecule SMILES.
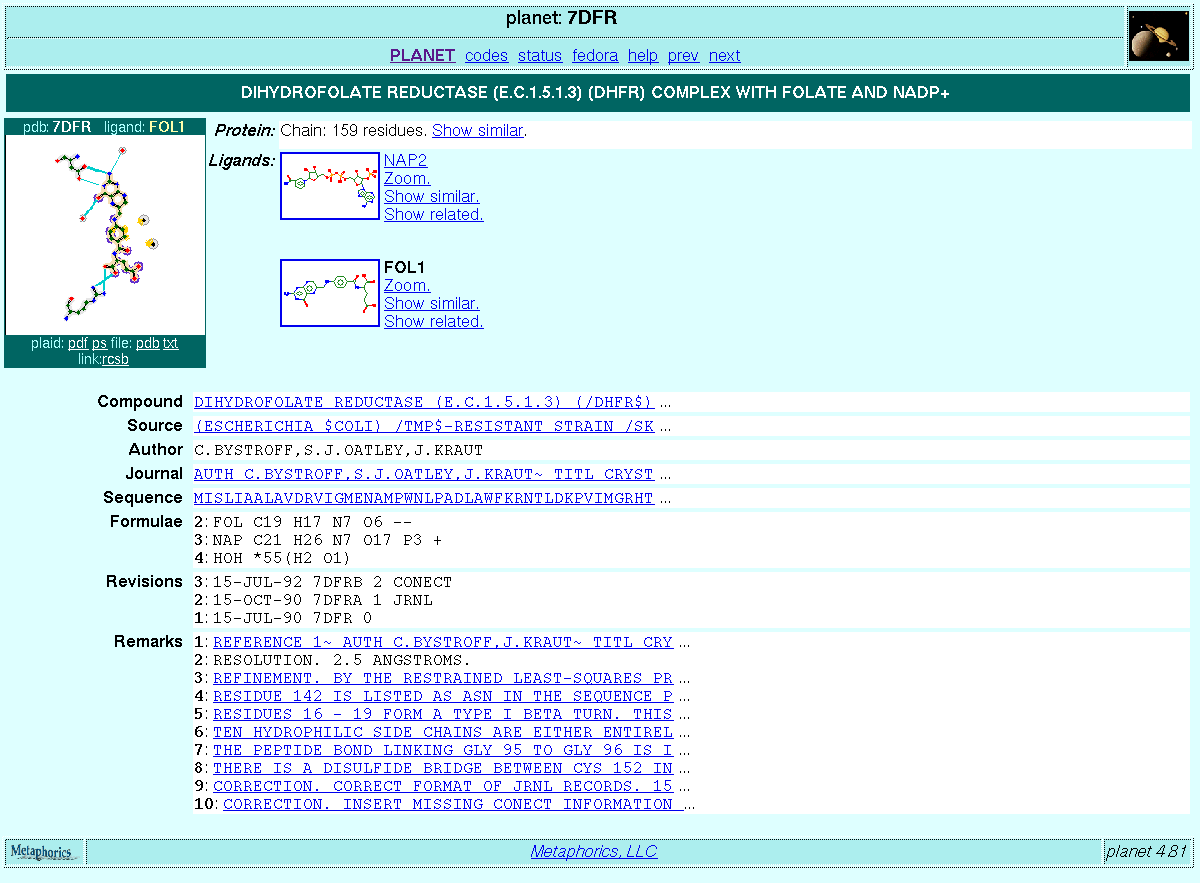
The PLAID subtrees and some of the information in the parent PDB trees are read into PLANET and used for generating the HTML pages on the fly. The PLAID subtrees are rendered in several different formats as required. For example, each PLANET page contains a thumbnail version of the PLAID:

It is also possible to ask the PLANET server for Postscript and PDF versions of the PLAID as well as a larger GIF version.
Demonstration access to PLANET along with a number of other Fedora servers is available. Please contact us to obtain a username and password for access.